A Roadmap Through the Lens of Volume
So, where’s the market going? More importantly, where isn’t it going? Too many traders fail to put enough emphasis on the latter. Through volume, we can understand two very important things:
Where the market is/isn’t interested in doing business.
Market inventory/positioning.
I utilize auction market theory in a completely fractal way. From top to bottom, high timeframe down to the final, executional trigger-pull on the DOM.
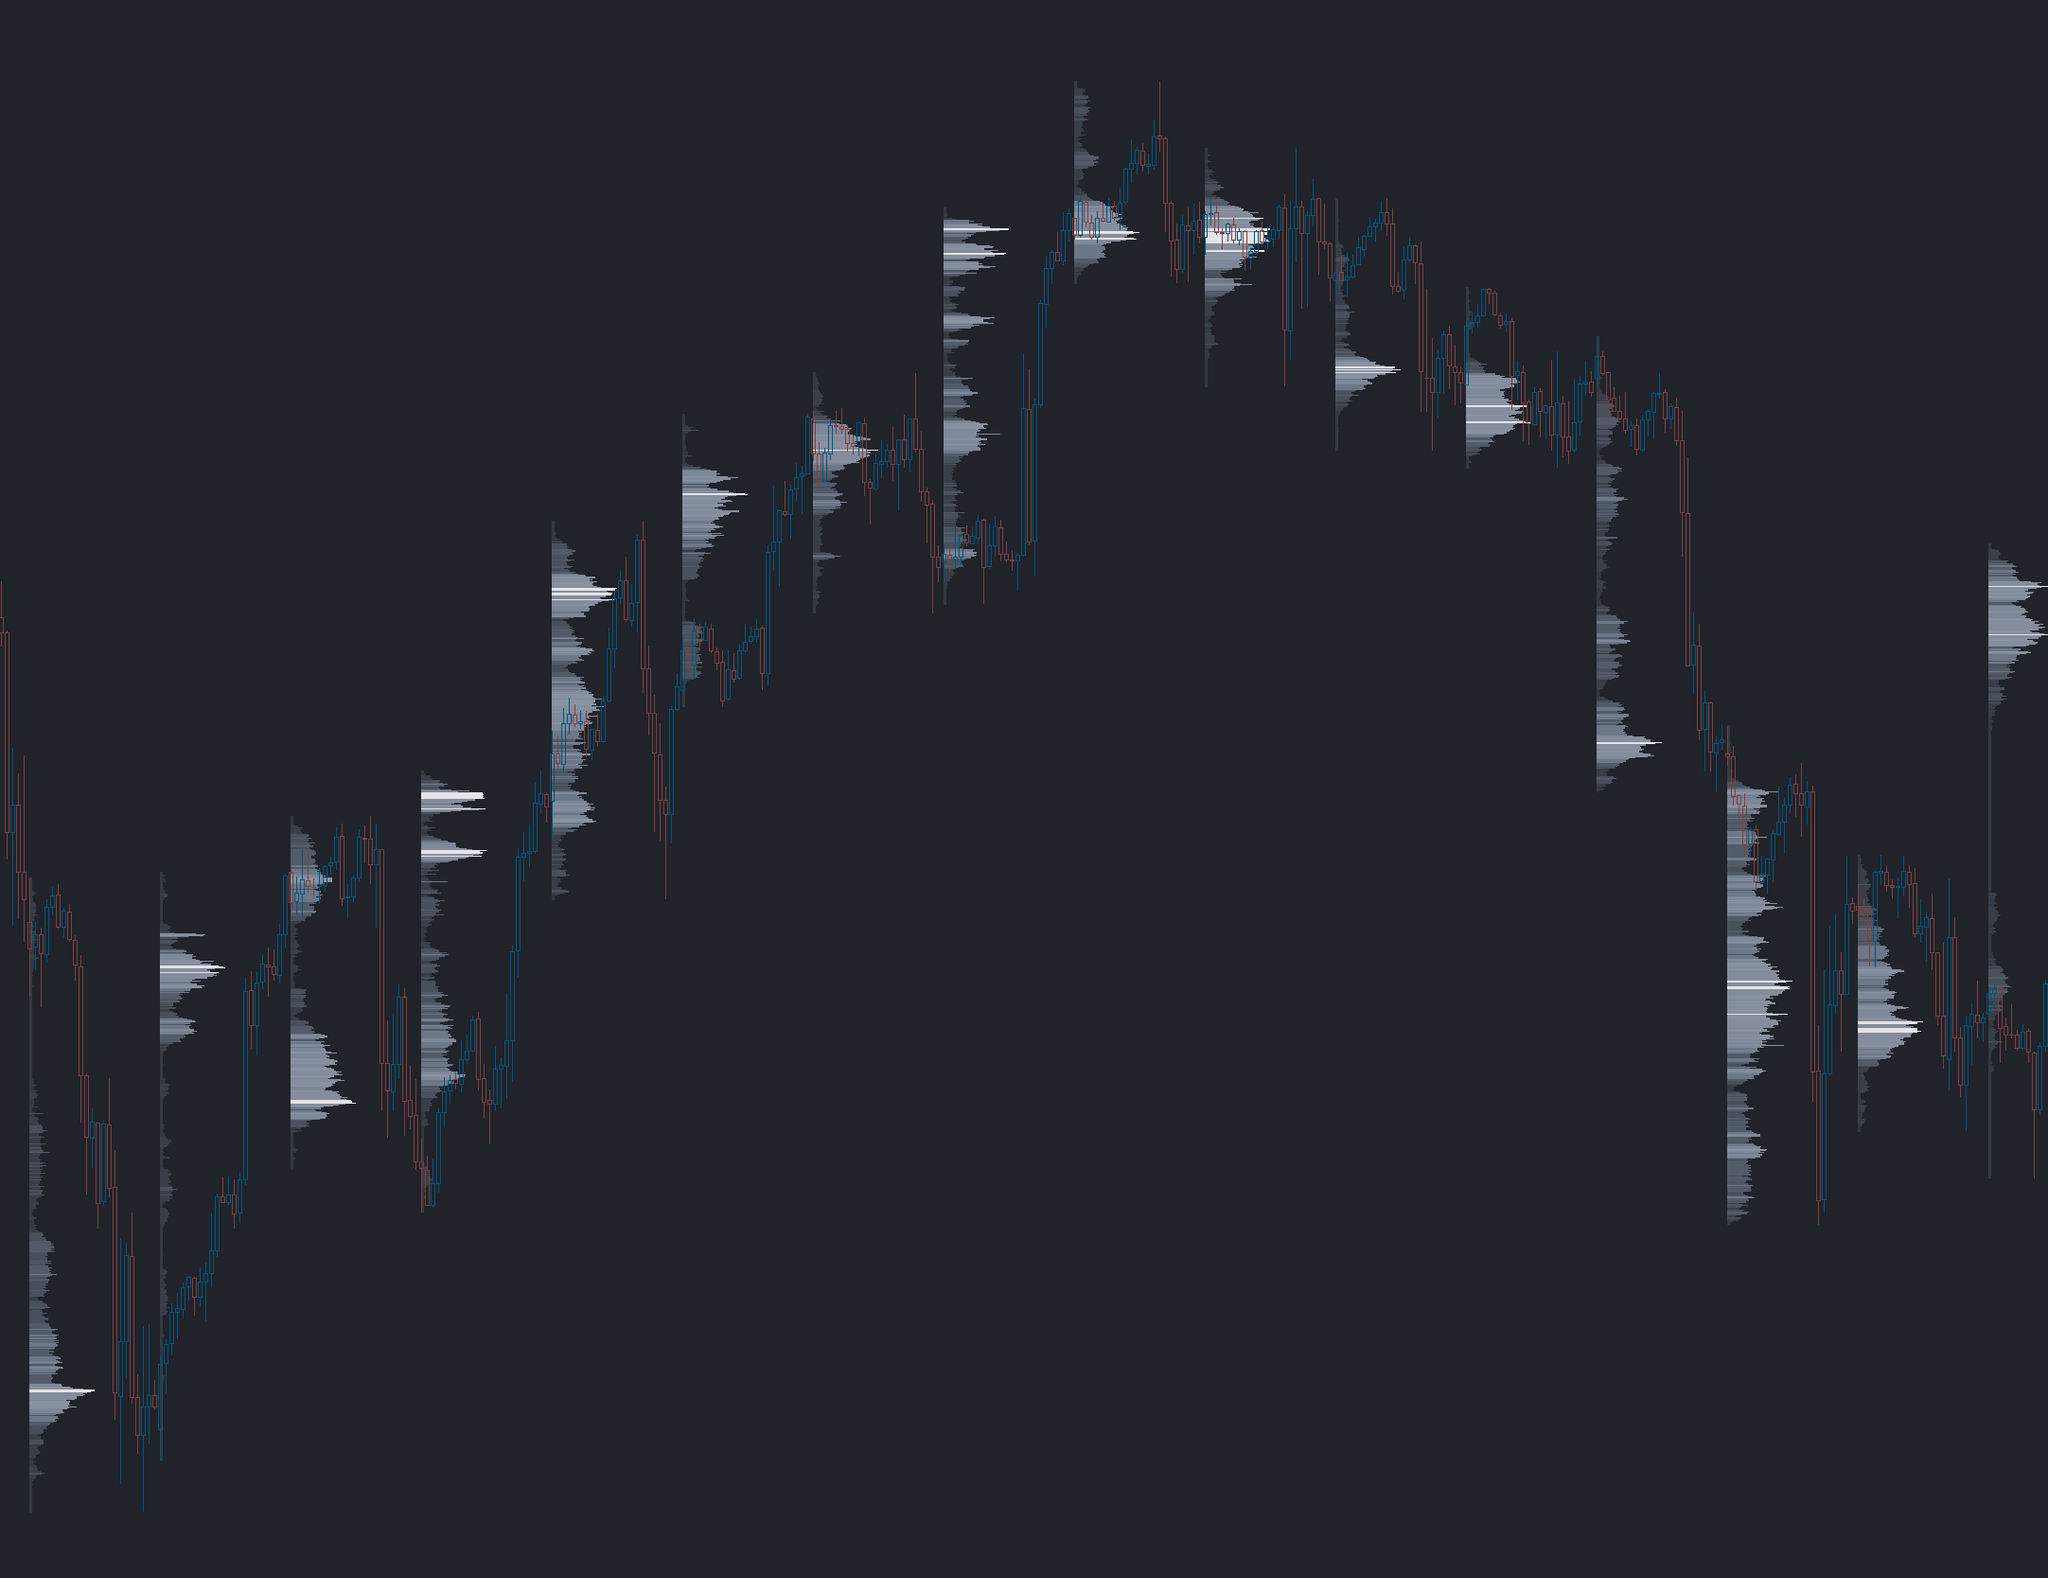
One-Directional Market / Trend
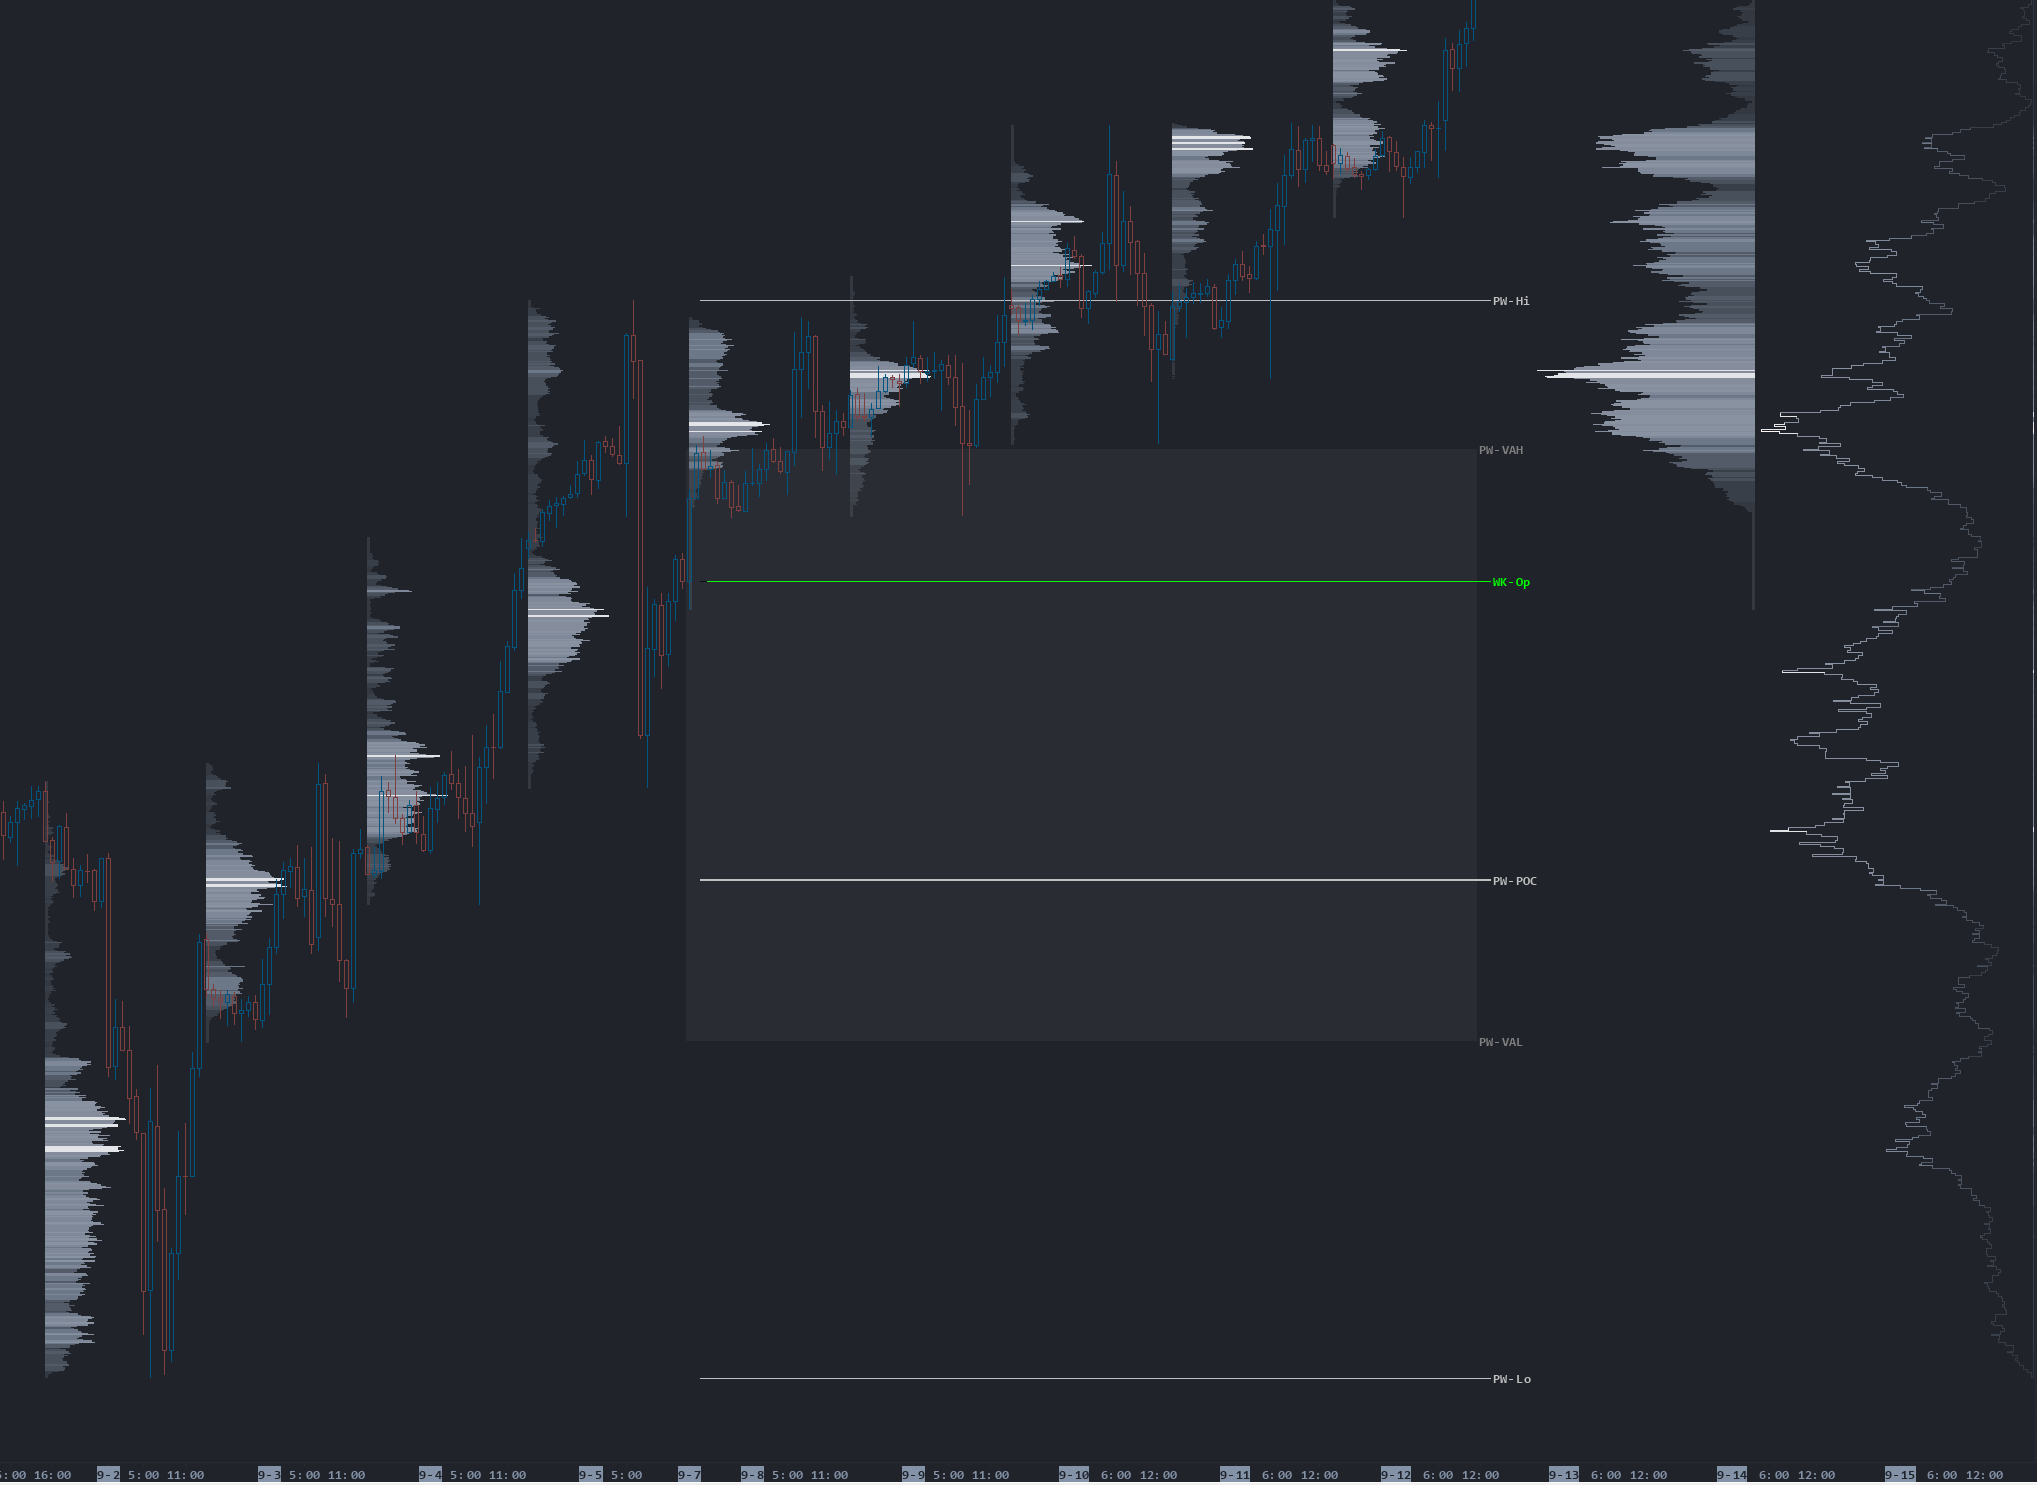
In this example, you can clearly see which direction the market is interested in going. As we take a look at the directional build of volume (interest), we can also note that the week opened towards the upper end of prior week’s value, failed to sustain any interest below and continued to build higher for the rest of the week. All the way through prior week’s high. The 5-day rolling VP clearly indicates that there is simply no interest from the market in trading back into prior week’s value area. Interest continues building higher and higher, signifying an imbalance of demand vs. supply. There is simply not enough sell interest in the market to meet the buyside demand, and when this happens, price will simply continue to melt up until it finds a balance. Vice versa for the downside.
However, this is only one piece of the puzzle. Noting this, we can infer that our edge lies in finding access in areas that the market is rejecting. This can be seen through a lack of volume. A range that is demonstrating an inability to sustain trade. To me, this is one example of how the market can show it’s hand, showing me where it doesn’t want to trade. If I’m looking for a long position, I simply need to wait until the market shows me which prices the sellers are unwilling to sell. These prices are not likely to sustain, as there aren’t enough sellers for the buyers to transact with, which would mean that the market, quite literally, cannot trade any lower. With this information, I can seek to get into a position to go against the downside direction.
After all, the market only has one job: to move until it finds a range that both buyers and sellers are happy to conduct business in. Balance.
Our job is to ask ourselves: who’s doing a better job at moving the market? Buyers or sellers?
Balance
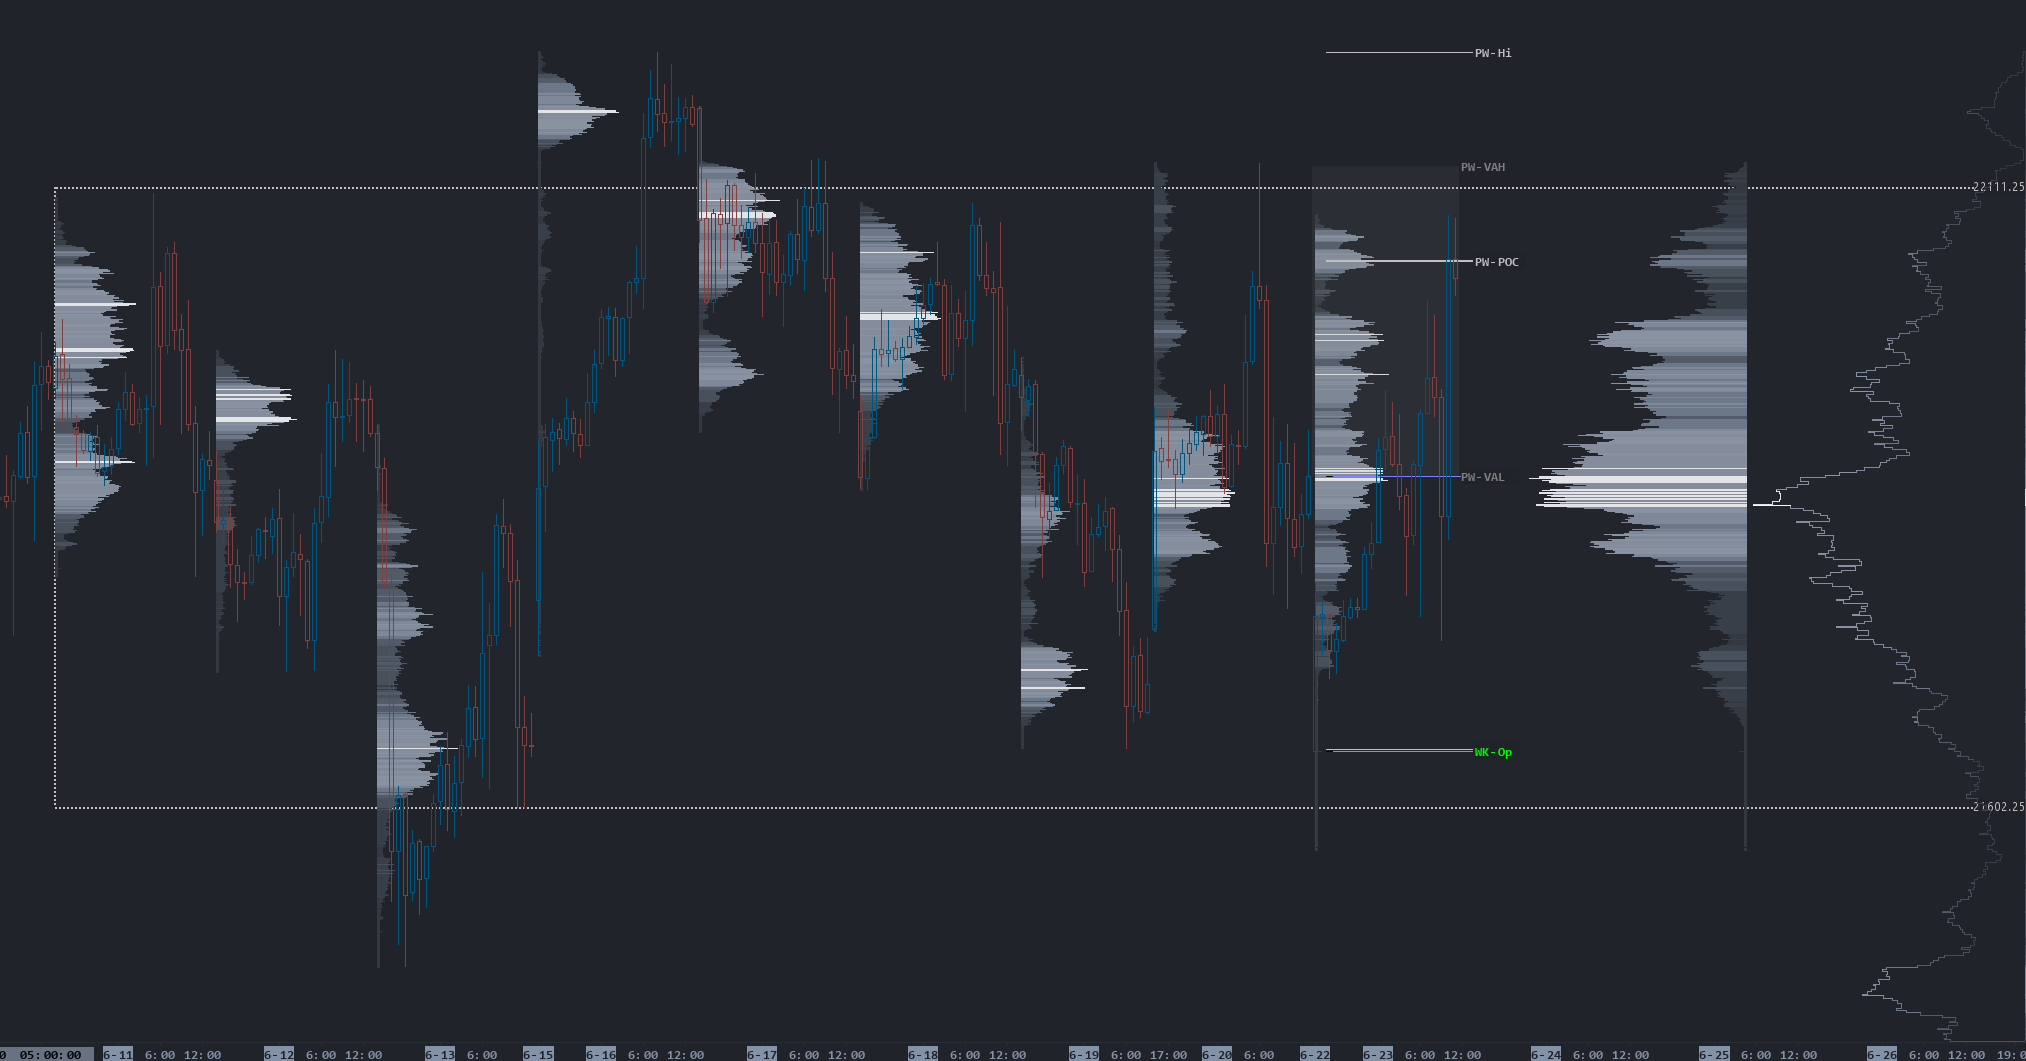
In this example, we’ve got a 9-day balance. Note the D-shape of the 5-day rolling VP, along with the LVN on the 30-day rolling VP (far right). At some point, the market had left a prior balance and found its way into the current balance, leaving an LVN between the two. It’s also important to note that we are stuck inside of prior week’s range and value. On day 3, the sellers push the market down, but fail to find enough interest to sustain trade outside of the range. The market then goes back into the range, where it continues to do business. There is simply not enough sell interest outside of the range for the time being, which forces the buyside interest to have to buy the prices back inside of the range. When a market peeks outside of balance and fails, it isn’t uncommon for it to move back through the range and test the other side.
As we see this occur on day 4, we get a nice build of a node on the upside, outside of the range. The market has seemingly found some sell interest. This is the only way a volume node can be built. When there is enough interest from both sides. On day 4, the market closes at the highs inside of the node, but opens below it on day 5 and shows an inability to trade back into it. Considering the fact that a 2-way tape is required to build a node, if a node is lost on the upside, we can infer that we’re now in a situation where there are offsides buyers. The buyside inventory that was placed inside of that node (the attempt to break outside of the range) is underwater, which now shows the market’s hand. The buyers put in a real attempt to break through and ultimately failed. There are still not enough buyers to push the market outside of balance. As the market begins to show acceptance back into the range, while simultaneously showing an inability to sustain any upside trade, we can position against the buyside weakness for a move into and through the range, where it once again tests the downside and finds absolutely no interest, leaving a strong tail and reversing back up and through the range.
This is a great example because it provides the two parameters that I look to play against:
Lack of interest, tapered volume.
Stuck/offside market participants.
Final Takeaways
When the market is quite literally showing you where the interest is going, do yourself a favor and do not take it for a liar. It has no interest on what your opinion(s) may be. The market, as a whole, has its own opinion(s) and by paying attention to the volume structure, you can literally see it for what it is. And more importantly, what it isn’t.
I do not subscribe to the theory that the market (AKA THEY) has any interest whatsoever in “faking out” or “manipulating” retail traders. We are trash liquidity. The market is not some evil cabal sitting at a round table in a high tower messing with retail traders just because they can.
The market simply functions as an auction between buyers and sellers. Stop reading so much into everything. LARPing isn’t necessary.